


Data quality refers to how well data serves its intended purpose. High-quality data is accurate, complete, consistent, and timely enough to support the decisions and processes that depend on it. Low-quality data introduces errors, inefficiencies, and risk into every business process it touches.
Understand what data quality really means, how it impacts every part of your business, and why getting it right is foundational to reliable analytics, AI, and operational excellence.
On September 23, 1999, a team of world-class engineers at NASA’s Jet Propulsion Laboratory held their breath. Hundreds of millions of miles away, the Mars Climate Orbiter, a robotic space probe worth $125 million, was about to enter orbit around the Red Planet. After a journey of 286 days, years of work by hundreds of brilliant minds were about to pay off. The team waited for the signal confirming the maneuver was a success.
That signal never came.
In the ghostly silence of the control room, a mission turned into a mystery. The orbiter had vanished. An investigation was launched immediately, and what it uncovered was not a catastrophic explosion or a complex hardware malfunction, but a simple, almost absurdly small error – a foundational mistake in its data.
The problem was a failure of translation. The software built by one engineering team at Lockheed Martin calculated thruster force using English units (pound-seconds). The ground-based software at NASA, which took that data and calculated the trajectory, expected those numbers to be in metric units (newton-seconds). No one built a conversion step into the software.
Every single course correction sent to the spacecraft during its nine-month journey was off by a factor of 4.45. The errors were tiny individually, but they accumulated relentlessly over 416 million miles. The orbiter didn’t miss Mars, but it approached it at a fatally low altitude. Instead of entering a stable orbit, the probe entered the upper atmosphere and disintegrated into dust and fire.
This is the ultimate, high-stakes lesson in why data quality is not just a business buzzword or a technical chore. It’s the bedrock of every decision we make based on information.
When we truly rely on data – whether to launch a spacecraft, diagnose a patient, or forecast a company’s revenue – the quality of that data can be the difference between spectacular success and mission failure.
What is data quality (and what it isn’t)?
The NASA story is a dramatic example of how a single flaw can lead to catastrophic failure, a direct result of poor data quality. But in business, data quality issues are often more subtle. They don’t announce themselves with a fiery explosion, but silently corrupt reports, mislead marketing efforts, and erode customer trust over time.
To prevent this, the first step is to understand what we truly mean when we talk about data quality. It’s more than just “good” or “bad” information; it’s a measurable and manageable discipline.
Data quality is the degree to which data is fit for its intended use in operations, decision-making, and planning. High-quality data is accurate, complete, consistent, and timely enough to serve the purposes of the people and systems relying on it. Crucially, quality is always relative to context: the same dataset can be perfectly adequate for one business purpose and dangerously inadequate for another.
What data quality is not is a one-time cleanup effort. Organizations that treat it as a project – something to fix once and then forget – inevitably find themselves back where they started. Sustainable data quality is a discipline embedded into processes, tools, and culture. It is, above all, an ongoing commitment to treating data as the business asset it truly is.
Data quality vs. data integrity: understanding the nuances
People often use the terms data quality and data integrity interchangeably, but they represent two distinct and vital concepts. Conflating them leads to misallocated effort and blind spots in your data strategy.
Data Quality describes the state or characteristics of data relative to its intended purpose. It asks: “Is this data fit to be used?” Achieving high-quality data means focusing on its attributes at the point of creation – whether from a primary data source or manual data entry – and throughout its lifecycle. It’s about ensuring the information itself is reliable.
Data Integrity, on the other hand, refers to the validity and structural soundness of data throughout its lifecycle. It asks: “Has this data remained whole and unaltered?” It’s a process-focused concept, designed to ensure that data is not accidentally or maliciously changed during storage, transfers, or processing. It protects the container, not the content.
Think of it like banking:
- Data Quality is making sure your starting account balance is recorded as $100.50, not $10,050. This is a matter of data accuracy.
- Data Integrity is ensuring that when you transfer $20, the system’s process prevents that transaction from being duplicated or corrupted, so your final balance is a perfect $80.50.
You need both, but they address different challenges. Data quality without integrity means you started with accurate numbers that were later corrupted in transit. Integrity without quality means your flawed data is perfectly preserved – errors and all. For a detailed breakdown of how these two disciplines interact and where responsibilities diverge in practice, see our dedicated guide: Data quality vs. data integrity: key differences explained.
The core dimensions of data quality
To measure and discuss the quality of data in a structured way, practitioners use a set of standard criteria known as data quality dimensions. These provide a common language for data quality assessment and help teams pinpoint the specific nature of a problem – rather than simply labeling data as “bad.”
While frameworks vary, most data governance bodies (including DAMA International’s DMBOK) converge on six core dimensions as the foundation:
1. Accuracy
Is the data correct? Does it accurately represent the real-world entity or event it describes? Inaccurate data is the most intuitive dimension of poor quality – a customer’s phone number with a transposed digit, a product price that hasn’t been updated in 18 months, a shipping address recorded in the wrong country field.
2. Completeness
Is all the necessary data present? Completeness failures occur when required fields are empty, records are partially populated, or entire datasets are missing expected entries. A CRM with 40% of companies missing an industry classification is technically a complete database – but incomplete data by this dimension.
3. Consistency
Does the data tell the same story across different systems? Inconsistencies arise when the same entity is represented differently in multiple databases – a customer listed as “active” in the CRM but “churned” in the billing system, or a product with different SKU codes in the warehouse and the e-commerce platform. Consistency is often the first casualty of siloed data architecture.
4. Timeliness
Is the data up-to-date enough for its intended use? Timeliness is context-dependent: a customer’s billing address only needs to be current at the point of invoicing, while a stock price used for algorithmic trading must be accurate to the millisecond. Stale data can be just as damaging as inaccurate data – it simply fails more slowly.
5. Uniqueness
Is the data free of duplicates? Duplicate records are one of the most common and costly data quality issues in enterprise environments. Duplicate customer profiles inflate marketing databases, skew analytics, and create frustrating experiences when customers receive the same communication multiple times. Uniqueness failures often accumulate silently over years before their impact becomes visible.
6. Validity
Does the data conform to the required format, type, and business rules? A date entered as “31/02/2024,” an email address without an “@” symbol, or a revenue figure recorded as a text string rather than a numeric value – these are all validity failures. Validity is the dimension most directly addressable at the point of data entry through input validation.
These six dimensions are the starting point for any structured approach to data quality. For a deeper exploration – including two additional advanced dimensions (Integrity and Accessibillity) and practical measurement approaches for each – see our comprehensive guide: The 8 dimensions of data quality: definitions, examples, and how to measure them.
Why is data quality important?
Understanding the dimensions of data quality is one thing; understanding their impact on your bottom line is another.
The reason data quality is important is that every single modern business initiative – from personalized marketing and business intelligence to AI and machine learning – is built upon a foundation of data. If that foundation is cracked, everything you build on top of it is at risk.
Consider what organizations are actually doing with their data today: training predictive models, automating operational decisions, building customer-facing personalization engines, and reporting to regulators. Each of these use cases inherits every flaw present in the underlying data. A recommendation engine trained on duplicate customer records learns the wrong preferences. A financial report built on inconsistent source systems produces numbers that contradict each other in the board presentation. An AI model fed on stale inventory data makes purchasing decisions that were wrong before anyone pressed “run.”
The consequences of ignoring the health of your enterprise data aren’t just theoretical; they are tangible, measurable, and they ripple across your entire organization.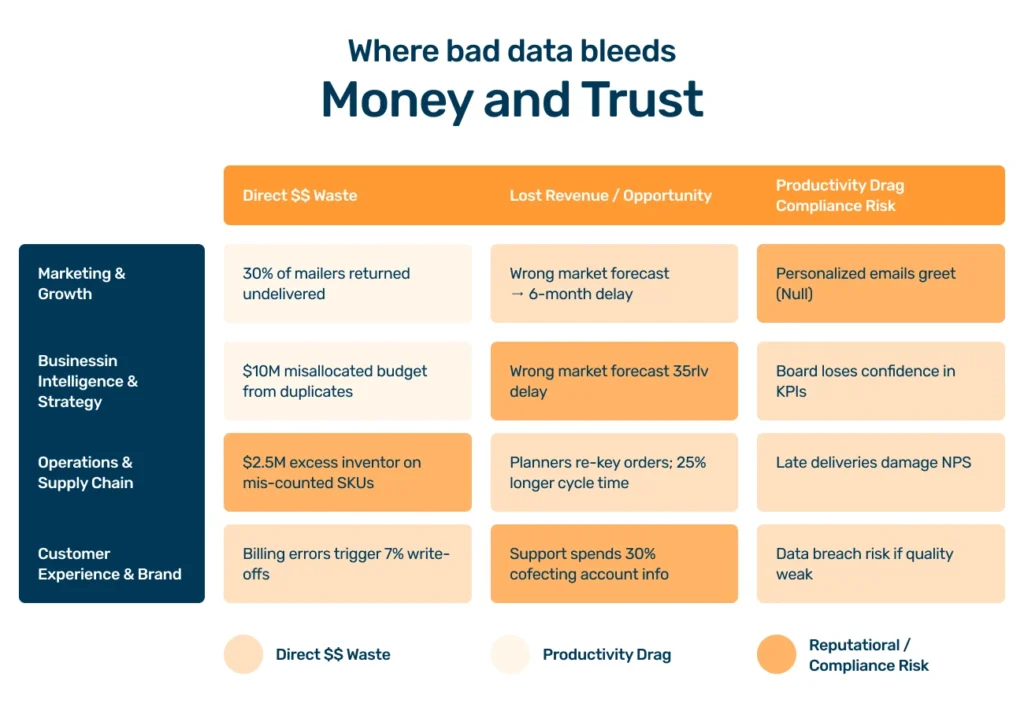
The hidden costs of poor data quality issues
One of the best frameworks for understanding the financial impact of bad data is the “1-10-100 Rule”, developed by data quality researcher Thomas Redman:
- It costs $1 to verify a record and fix an error at the point of data entry.
- It costs $10 to find and cleanse that same record later on.
- It costs $100 (or more) if you do nothing and make decisions based on that flawed data.
IBM estimates that poor data quality costs the US economy alone approximately $3.1 trillion per year. Gartner research puts the average financial impact of bad data on individual organizations at $12.9 million annually. These numbers aren’t anomalies – they reflect the cumulative weight of small errors that compound across systems, teams, and time.
These costs manifest in ways that are often hidden in plain sight:
| Area of impact | Example of hidden costs |
| Wasted resources | Marketing departments spend fortunes on campaigns targeting flawed customer data, with mailers returning to sender and emails bouncing, directly impacting budget and ROI. |
| Flawed insights | Strategic decisions are made based on BI dashboards skewed by duplicate data or inconsistent data, leading the company to invest in the wrong products or markets. |
| Operational inefficiency | Supply chains grind to a halt because of poor data accuracy in inventory systems, leading to stockouts that frustrate customers or overstocking that ties up capital. |
| Reputational damage | Nothing erodes customer trust faster than repeated billing errors or addressing them by the wrong name, leading to churn and negative word-of-mouth. |
| Regulatory exposure | In heavily regulated industries, data errors that surface during an audit or breach investigation can trigger fines, remediation requirements, and reputational damage that far exceeds the cost of prevention. |
These are just a few categories of common data quality problems. For a systematic breakdown of the most frequent types of data quality failures – including root causes and detection strategies – see our guide: Common data quality issues: types, causes, and how to fix them.
The tangible ROI of a robust data management strategy
The good news is that the flip side is equally true. Investing proactively in data quality yields significant and measurable returns. When you address data problems head-on, you don’t just avoid costs – you create value.
Consider these examples of high-quality data driving business outcomes:
Enhanced personalization and revenue growth
A global e-commerce leader increased its revenue by over 15% by using clean, accurate, and complete customer profiles to power its recommendation engine. This made every interaction more relevant and directly led to increased customer lifetime value.
Streamlined operations and cost savings
A logistics company saved millions in fuel and shipping costs by improving the data accuracy of its routing and scheduling systems. This ensured its fleet was always on the most efficient path, reducing waste and improving delivery times.
Strengthened compliance and customer trust
A financial institution avoided hefty regulatory fines and built stronger customer trust by implementing rigorous quality standards for its enterprise data. This ensured it could pass any audit with confidence and protect its customers’ sensitive information.
The pattern across these cases is consistent: organizations that treat data quality as a strategic investment – rather than a cost center or a cleanup task – find that it amplifies the return on every other data initiative they undertake. Clean, reliable data turns your information into a genuine competitive asset. When you can rely on data, you can lead with confidence.
From reactive to proactive: the evolution of data quality management
Now that we understand what data quality is and why it’s a critical business priority, the question becomes: how do successful organizations actually manage it over time?
For years, many organizations practiced what practitioners call “archaeological” data quality management. They would wait until a business user’s report was disastrously wrong, then dig through layers of data to find the source of the problem. Someone would open a ticket. A data engineer would spend three days tracing the issue back to a pipeline that had been silently dropping records for six months. A one-off fix would be applied. The cycle would repeat.
This reactive approach – fixing errors long after they’ve occurred and after decisions have already been made on flawed data – is expensive, inefficient, and fundamentally keeps you one step behind the business.
The modern approach is proactive. It means building quality checks, validation rules, and monitoring into the entire data lifecycle, from the moment data enters your ecosystem to the moment it surfaces in a dashboard or feeds a model. The goal is to catch and resolve issues automatically before they ever reach a business user.
This shift from reactive to proactive data quality management involves three interconnected disciplines:
Data quality control focuses on detecting and blocking errors at defined checkpoints in your data pipelines – validation gates that prevent malformed, incomplete, or out-of-range data from propagating downstream. For a technical deep-dive into how to implement these checkpoints, see: Data quality control: how to detect, block, and fix pipeline errors.
Data quality assurance operates upstream of control: it’s the set of processes, standards, and practices designed to prevent errors from being introduced in the first place. Where control is reactive to what enters the pipeline, assurance shapes how data is collected, defined, and governed before it ever gets there. See our full guide: Data quality assurance: building prevention into your data processes.
Data quality monitoring provides continuous, ongoing visibility into the health of your data in production. Unlike profiling – which takes a snapshot at a point in time – monitoring watches your pipelines in real time and alerts you when statistical patterns deviate from the norm.
Together, these three disciplines form the operational backbone of a mature data quality management program. The organizations that have made this shift report not only fewer data incidents, but a measurable improvement in the speed at which their teams can act on data – because they spend less time questioning whether the numbers can be trusted.
Choosing the right data quality management tools
There is no single magic button to fix all data problems. An effective strategy typically involves a stack of specialized tools, each serving a distinct purpose at a different stage of the data lifecycle. Understanding what each category does – and where it fits – is the prerequisite for making sound technology decisions.
Data profiling tools
This is your starting point. Before you can fix your data, you need to understand it. Data profiling tools scan your databases, data lakes, or other source systems to create a statistical summary of what’s actually there.
They help you answer critical diagnostic questions: Are there null values in this column? What are the most common formats for dates in this field? How many unique values exist, and how are they distributed? Are there referential integrity violations between tables?
This discovery phase is essential. Organizations that skip profiling and go straight to cleansing typically spend weeks fixing the wrong things. Profiling tells you where your quality investment will have the highest impact.
Data cleansing tools
Once you’ve identified problems through profiling, cleansing tools help you correct them. These solutions are designed to standardize, enrich, deduplicate, and repair data at scale – transforming inconsistent, malformed, or incomplete records into a standardized, reliable asset.
Modern cleansing tools operate both in batch mode (processing entire datasets on a schedule) and inline (validating and correcting data as it enters a pipeline in real time). The distinction matters: batch cleansing is appropriate for legacy datasets, while inline validation is the right approach for any new data entering production systems.
Data observability platforms
This is the cutting edge of operational data quality management. Unlike profiling – which takes a snapshot in time – observability platforms provide continuous, real-time monitoring of your data pipelines in production.
By learning the statistical “normal” patterns of your data (typical row volumes, distribution of values, schema structure, freshness), these platforms can detect anomalies the moment they occur: a sudden drop in record volume, an unexpected null rate spike, a schema change that breaks a downstream model. This shifts your quality program from periodic audits to always-on surveillance.
For a detailed comparison of what data observability is, how it differs from traditional data quality management, and when each approach is appropriate, see: Data observability vs. data quality: what’s the difference and do you need both?
Choosing the right platform for your organization
The market for data quality tooling has expanded significantly in recent years, spanning point solutions, platform suites, and integrated modules within broader data governance platforms like Collibra. The right choice depends on your data architecture, team maturity, and the specific quality dimensions that matter most to your use case.
For a curated overview of the leading solutions available today, see: 10 best data quality tools: a comprehensive guide. If you’re actively evaluating vendors and need a structured decision framework – including the questions to ask, the capabilities to prioritize, and the pitfalls to avoid – see: How to choose a data quality platform.
The power of automation and machine learning in data quality
While traditional data quality tools rely on user-defined rules – “flag any ZIP code that is not 5 digits,” “reject any record where revenue is negative” – rules-based approaches have a fundamental ceiling. They can only catch the errors you thought to look for. They require manual maintenance as your data evolves. And they don’t scale to the complexity of modern enterprise data environments, where thousands of tables and dozens of integrated systems interact in ways no single team can fully map.
Machine learning changes the calculus by enabling your quality program to detect errors it was never explicitly taught to find.
| ML capability | How it improves data quality |
| Anomaly detection | Identifies records or patterns that deviate statistically from the norm – catching issues that no predefined rule would surface |
| Duplicate detection | Recognizes that “John Smith, 42 Main St” and “J. Smith, 42 Main Street” are the same entity, even without an exact string match |
| Schema drift detection | Detects when the structure or distribution of incoming data has changed in ways that indicate an upstream problem |
| Adaptive learning | As your data and business rules evolve, models retrain on new patterns rather than requiring manual rule updates |
| Quality at scale | Automates issue identification across datasets too large for manual review, maintaining quality standards across millions of records |
The practical implication is that ML-augmented data quality management is no longer a luxury reserved for organizations with mature data science teams. Modern observability platforms and governance tools increasingly embed these capabilities as features rather than requiring custom model development.
Beyond detection, automation is transforming the remediation side of data quality as well – enabling organizations to resolve certain classes of errors automatically (standardizing address formats, deduplicating on defined keys, enriching incomplete records from reference datasets) without human intervention.
For a practical guide to what data quality automation looks like in enterprise environments – including what can realistically be automated, what shouldn’t be, and how to implement it – see: Data quality automation: a practical guide for enterprise teams.
Data governance: the foundation of a strong data culture
Even the most powerful tooling stack will ultimately underperform if the organization’s governance structure isn’t in place. Technology enables data quality; it cannot substitute for it. The most advanced anomaly detection platform is still pointing at symptoms – it can tell you that a field is inconsistent across systems, but it cannot tell you which system is authoritative, who owns the decision to resolve it, or what the standard should be going forward.
These are governance questions, and they require human answers embedded in organizational structures.
Data governance is the formal orchestration of people, processes, and technology that enables an organization to treat its data as a managed business asset. It provides the framework that answers the questions no tool can answer on its own:
- Who has ownership of this data domain?
- What are the official quality standards for our customer data?
- Who has the authority to define, change, or resolve data issues?
- How do we ensure data is used consistently, securely, and ethically across the organization?
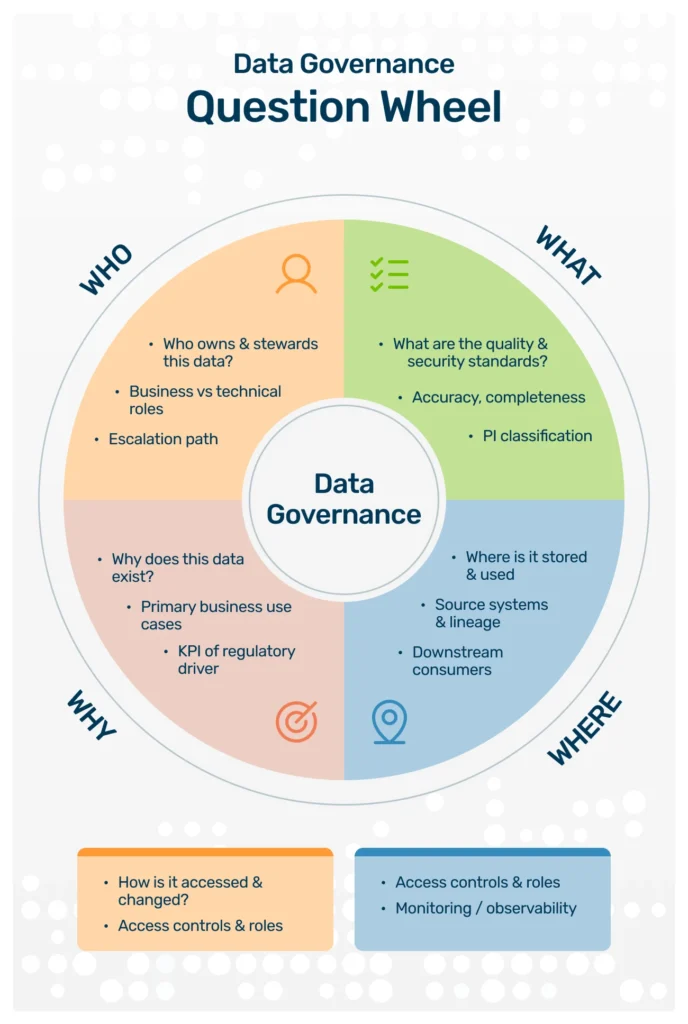
A strong governance program creates the clear accountability and consistent rules of the road that prevent the silos and miscommunication that so often generate poor data quality in the first place. It transforms data quality from a technical responsibility owned by IT into a shared business discipline owned by the people closest to the data.
It’s worth being precise about how governance and quality relate – because the two concepts are often conflated in ways that create confusion about where to start. Data governance is the system that defines standards, assigns ownership, and establishes accountability. Data quality is the outcome that governance, when well-executed, makes possible. Governance without a quality program produces well-documented bad data. A quality program without governance produces locally clean data that conflicts across systems. For a detailed exploration of how these two disciplines interact in practice, see: Data quality vs. data governance: understanding the relationship.
The most effective organizations don’t choose between governance and quality – they treat them as two sides of the same commitment to trustworthy data. That commitment is what a data strategy makes explicit and actionable. If your organization is at the stage of formalizing that commitment – defining what good looks like, how to prioritize effort, and how to sustain progress over time – our guide on building a data quality strategy provides a structured starting point.
Measuring and reporting on data quality
A data quality program without measurement is, at best, an act of faith. At worst, it’s a budget line that produces activity without accountability. If you cannot quantify the current state of your data, you cannot demonstrate improvement, justify investment, or identify where effort is most needed.
Measurement is also what transforms data quality from a vague organizational aspiration into a managed discipline. The moment you attach numbers to quality – even imperfect numbers – you change the conversation from “our data is bad” to “our customer domain has a 73% completeness rate on company size, and it’s cost us three misallocated campaign budgets this quarter.”
Defining your data quality metrics
The starting point is choosing the right metrics – the specific, quantifiable indicators that reflect the quality dimensions that matter most to your business. Not every dimension deserves equal attention in every context. A logistics company should weight timeliness and accuracy of address data heavily. A financial services firm will prioritize completeness and validity of transaction records. A healthcare organization will treat accuracy of patient identifiers as non-negotiable.
Common data quality metrics include completeness rate (percentage of required fields populated), accuracy rate (percentage of records verified against a trusted reference), duplicate rate (percentage of records identified as duplicates within a dataset), validity rate (percentage of records conforming to defined format and business rules), and freshness (time elapsed since last update relative to a defined threshold).
For a full breakdown of which metrics to define for each quality dimension, how to calculate them, and how to set meaningful thresholds for your organization, see: Data quality metrics: what to measure and how.
The data quality scorecard
Once you have defined your metrics, the next step is aggregating them into a coherent view that business stakeholders can actually use. This is where the data quality scorecard comes in.
A scorecard provides a structured, domain-by-domain summary of your data quality performance – typically showing current scores against defined targets, trend direction over time, and flagging the domains or datasets that require attention. It serves two audiences simultaneously: the data governance team, which needs operational detail to prioritize remediation effort; and leadership, which needs a strategic summary to understand organizational data health and track the return on quality investment.
A well-designed scorecard is not a one-time audit deliverable. It’s a living instrument, updated on a regular cadence, that holds teams accountable to defined standards and makes quality performance visible across the organization. For a detailed guide on how to design and implement one, see: Data quality scorecard: how to design, implement, and use one effectively.
The data quality dashboard
Where the scorecard provides a structured summary, a data quality dashboard provides real-time operational visibility. In modern data environments – where pipelines run continuously and downstream systems depend on fresh, reliable data – waiting for a weekly scorecard to discover a quality incident is too slow.
A dashboard built for operational monitoring surfaces current metric values, pipeline health indicators, and active anomalies in a format that data engineers and stewards can act on immediately. The most effective dashboards combine automated alerting (notify the right person when a metric crosses a threshold) with drill-down capability (trace a quality issue back to its source pipeline or upstream system).
For guidance on what to include, how to structure the views for different audiences, and which tools to use, see: Data quality dashboard: what to track and how to build one.
The data quality report
Scorecards and dashboards serve operational and tactical audiences. The data quality report serves a different purpose: it provides a formal, periodic record of data quality performance for governance reviews, executive briefings, regulatory documentation, and cross-functional alignment.
A quality report typically covers a defined period (monthly or quarterly), summarizes performance against targets across all monitored domains, documents the root causes and resolution status of significant incidents, and presents trend analysis to show whether the program is moving in the right direction.
For enterprise organizations subject to data regulation (GDPR, BCBS 239, DORA), the quality report is also an audit artifact – evidence that quality standards exist, are measured, and are actively managed. For a comprehensive guide to what a data quality report should contain and how to automate its production, see: Data quality report: what to include and how to automate it.
Building your enterprise data quality framework
Your data quality framework is the practical blueprint that brings your governance strategy to life. Where strategy answers “what are we trying to achieve and why,” the framework answers “exactly how do we do it, who is responsible, and how will we know if it’s working.”
A mature enterprise data quality framework typically covers five interconnected components:
- Scope and data domains – which datasets, systems, and business processes are covered by the framework, and in what priority order. Trying to govern everything at once is a reliable path to governing nothing effectively.
- Roles and accountability – formal definitions of who owns what. This includes data owners (accountable for the business value and fitness of a data domain), data stewards (responsible for day-to-day quality management within a domain), and data consumers (accountable for reporting quality issues they encounter back to the appropriate owner).
- Quality standards and rules – the explicit, documented thresholds that define “acceptable” quality for each domain and dimension. These should be driven by business requirements, not technical preferences: the standard for customer email completeness should be set by marketing’s needs, not by what’s easiest to enforce.
- Processes and workflows – how issues are detected, escalated, assigned, resolved, and verified. This includes the integration of quality checks into data pipelines, the process for handling exceptions, and the cadence of governance reviews.
- Technology and tooling – which platforms, tools, and integrations support the framework’s operational execution, and how they connect to each other.
This isn’t a static document you create once and file away. A framework that isn’t regularly reviewed against evolving business needs, data architecture changes, and new regulatory requirements will drift out of relevance within months. For a structured guide to designing and implementing each of these components, see: Data quality framework: how to design one that actually works.
From strategy to action with Collibra and Murdio
Designing a framework is one thing; implementing it across a complex enterprise data environment is another. This is where a platform like Collibra becomes essential – providing a central system of record for data ownership, quality rules, issue workflows, and governance documentation that spans the entire organization.
At Murdio, we specialize in implementing Collibra data governance solutions, helping enterprise teams bridge the gap between a governance framework on paper and one that is actively used, maintained, and trusted. If you’re ready to move from strategy to execution, let’s talk about how we can accelerate your data quality journey.
Data quality across industries
The principles of data quality – accuracy, completeness, consistency, timeliness – are universal. Their application is not. The specific quality failures that cause the most damage, the regulatory standards that define minimum acceptable thresholds, and the business processes most exposed to data risk vary significantly by industry. A data quality program that ignores this context will systematically under-invest in the dimensions that matter most for its sector.
Manufacturing
In manufacturing environments, data quality failures have direct operational consequences: production downtime, inventory miscounts, quality control failures that reach customers, and safety incidents traced back to incorrect equipment or material specifications.
The dimensions that matter most in manufacturing are accuracy (is this the correct specification for this component?), timeliness (is this sensor reading or inventory count current enough to act on?), and consistency (does the same part have the same identifier across procurement, production, and maintenance systems?). Data siloes between ERP, MES, and quality management systems are a persistent source of inconsistency that compounds in high-volume production environments.
For a sector-specific breakdown of data quality challenges, failure patterns, and management approaches in manufacturing, see: Data quality in manufacturing: challenges, strategies, and best practices.
Retail
Retail data quality challenges are shaped by the sheer volume and velocity of data generated across channels – POS transactions, e-commerce events, loyalty programs, supplier feeds, and inventory systems – and the speed at which poor quality in any of these streams translates into visible customer experience failures.
The highest-impact quality dimensions in retail are uniqueness (duplicate customer profiles destroy personalization and inflate marketing costs), completeness (missing product attributes degrade search and recommendation performance), and timeliness (stale inventory data leads to selling products that aren’t available and failing to sell products that are). Omnichannel retail amplifies all of these challenges, because the same customer, product, and inventory data must be consistent across physical and digital touchpoints simultaneously.
For a practical guide to the most common data quality failures in retail environments and how to address them, see: How to improve data quality in retail: a practical guide.
Financial services, healthcare, and beyond
Manufacturing and retail illustrate the industry-specificity of data quality at scale, but the pattern holds across every data-intensive sector. Financial services organizations face data quality requirements shaped by regulatory frameworks like BCBS 239 and DORA, where the accuracy and lineage of risk data is subject to supervisory scrutiny. Healthcare organizations operate under data quality obligations tied directly to patient safety, where an error in a medication record or clinical identifier can have irreversible consequences.
As Murdio’s content on industry-specific data quality challenges continues to expand, this section will grow to reflect the specific contexts our clients operate in.
A practical guide to data quality best practices
Understanding the theory, the costs, and the need for governance is crucial – but it can also feel overwhelming. The most important thing to remember is that you don’t have to boil the ocean. The journey to high-quality data begins with a single, deliberate step.
Before you invest in new tooling or launch a governance program, embed these four foundational principles into how your organization thinks about data.
1. Start with assessment, not assumption
The most common mistake organizations make when beginning a data quality initiative is assuming they know where the worst problems are. They usually don’t – at least not completely. Business users report the symptoms they encounter, not the root causes. Data engineers fix the issues that surface in their pipelines, not the ones accumulating silently elsewhere.
The essential first move is a structured data quality assessment: a systematic review of your most critical data domains that establishes a documented baseline of current quality across all relevant dimensions. Without this baseline, you cannot prioritize intelligently, measure improvement, or demonstrate ROI.
For a step-by-step methodology for conducting an assessment – including which data domains to prioritize, which dimensions to evaluate, and how to score and document your findings – see: Data quality assessment: how to evaluate your data and build a baseline.
2. Prioritize ruthlessly
Don’t try to fix all your enterprise data at once. Identify a single, high-value business process that is visibly suffering from poor data quality – the lead-to-cash process, marketing campaign targeting, inventory management, or financial close – and focus your initial effort there.
A targeted first win does two things simultaneously: it delivers measurable business value that justifies continued investment, and it gives your team the operational experience of running a quality improvement cycle from diagnosis through remediation to monitoring. Both are essential before you scale.
For a structured approach to prioritizing and sequencing a data quality improvement initiative, see: Data quality improvement: how to prioritize, execute, and sustain progress.
3. Build quality into pipelines, not onto them
A one-time cleanup project will provide temporary relief. The problems will return – typically within months – because the underlying processes that generate bad data haven’t changed. Sustainable improvement requires embedding data quality checks directly into your data ingestion, transformation, and delivery pipelines so that issues are caught and flagged at the point of entry rather than discovered downstream.
This means validation rules applied during ingestion, schema checks on incoming feeds, automated alerts when statistical patterns deviate from defined norms, and rejection workflows that route bad records to a quarantine queue rather than allowing them to propagate into production systems.
For a technical guide to designing and implementing quality checks across the data pipeline, see: Data quality checks: what they are, types, and how to implement them.
4. Assign clear ownership before you do anything else
Data quality is everyone’s responsibility in theory. In practice, without explicit, named accountability, it becomes no one’s responsibility. Before launching any quality initiative, establish who owns each critical data domain – not as a bureaucratic exercise, but as the prerequisite for every other decision that follows.
The data owner is the person who defines quality standards for their domain, approves changes to how that data is used, and is accountable when quality fails. Without that role filled and understood, quality checks flag issues that no one resolves, assessments produce findings that no one acts on, and tools generate dashboards that no one reads.
For a comprehensive reference on the full range of practices that underpin a mature data quality program – from data entry standards to remediation workflows to cross-functional accountability models – see: Data quality best practices: a complete guide for enterprise teams.
Future-forward: the next frontiers of data quality
While the core principles of accuracy, completeness, and consistency are timeless, the technological landscape is in constant motion. A truly effective data strategy must not only address the challenges of today but also anticipate the frontiers of tomorrow.
Data quality in the age of AI and big data
The rise of large-scale AI systems has elevated the consequences of poor data quality to an entirely new level. Machine learning models don’t just use data – they encode it. Biases, inaccuracies, and gaps in training data become embedded in model behavior in ways that are difficult to detect and costly to correct after the fact.
The phrase “garbage in, garbage out” has never been more consequential. An LLM fine-tuned on inconsistent internal documentation will produce inconsistent outputs. A predictive model trained on historically biased data will perpetuate and amplify that bias at scale. The organizations that will extract sustainable value from AI are those that treat data quality as the foundation of their AI strategy – not an afterthought.
The challenge of big data adds a velocity dimension to this problem. With massive volumes of real-time data flowing from IoT devices, clickstreams, and event streams, the annual or quarterly data cleansing cycle is obsolete. This environment demands continuously automated, machine-learning-driven observability to ensure quality in motion – not just quality at rest.
Web3 and blockchain
Blockchain technology offers unprecedented data integrity: its distributed and immutable nature prevents data from being altered after it’s recorded. However, this creates a new, high-stakes quality challenge. If incorrect data is written to the chain, it is permanently and transparently wrong. There is no correction, no patch, no retroactive cleanse. This elevates the importance of “right-at-the-source” validation to an entirely new level – the cost of a quality failure moves from expensive to irreversible.
The metaverse and spatial data
As virtual and augmented environments develop, they will generate an explosion of new, largely unstructured data types: spatial interactions, avatar behaviors, real-time verbal commands, and digital asset transactions. Ensuring the quality and consistency of this complex, multi-dimensional data will be a core challenge for the next generation of data management – requiring quality frameworks that extend well beyond the structured, tabular data most current tooling is built to handle.
Gamification of data stewardship
One of the persistent challenges in any data governance program is sustaining employee engagement over time. Gamification offers a behavioral design solution: applying game mechanics to the work of data stewardship to make it visible, competitive, and rewarding.
Imagine a system where data stewards earn recognition for resolving quality issues within SLA, where teams compete on accuracy scores for their domains, or where employees are rewarded for identifying previously unknown data sources or proposing new quality rules. By making stewardship tangible and the outcomes of quality effort visible, gamification can transform a perceived administrative burden into a cultural practice.
The future of master data management
Modern master data management is expanding beyond its traditional focus on single entities like “customer” or “product” to become a multi-domain hub – managing the complex, interconnected relationships between dozens of entity types simultaneously. Powered by AI and graph database technologies, next-generation MDM will not just store master records but actively discover relationships, surface contextual quality signals, and serve as the intelligent core of the entire enterprise data landscape.
Conclusion: the journey to data quality is a marathon, not a sprint
We began this guide with a mission to Mars – a $125 million lesson in what happens when the people making critical decisions cannot trust the data they’re acting on. We’ve traveled from that dramatic illustration through the definitions, dimensions, costs, tools, governance structures, measurement systems, and industry applications that define what a mature data quality program actually looks like.
The through-line across all of it is consistent: data quality is not a project with a finish line. It is a continuous discipline – a cultural commitment to treating data as a business asset that must be actively managed, measured, and improved over time.
The organizations that will lead their industries in the next decade will be those that make this commitment early and systematically. Not because they have the most sophisticated tools or the largest data teams, but because they have built the governance structures, the accountability frameworks, and the operational habits that make trustworthy data the default – not the exception.
The journey may feel long from where you are today. But it begins with one decision: to understand your current state before assuming you know it. Start by conducting a data quality assessment to establish your baseline. Define the metrics that will make your progress visible. Build a framework that your teams can actually use. And if you’re ready to accelerate that journey with Collibra at the center of your governance architecture, let’s talk.
Frequently asked questions about data quality
The six core dimensions are accuracy (is the data correct?), completeness (is all required data present?), consistency (does the data agree across systems?), timeliness (is the data current enough for its use?), uniqueness (are there no duplicate records?), and validity (does the data conform to defined formats and rules?). For a full breakdown including two additional advanced dimensions, see our guide to the 8 dimensions of data quality.
Data quality describes the fitness of data for its intended use – whether the information itself is accurate, complete, and reliable. Data integrity describes whether data has remained whole and unaltered through storage, processing, and transfer. You need both: quality ensures you started with the right information; integrity ensures it wasn’t corrupted along the way. See our full comparison: data quality vs. data integrity.
Data governance is the system of people, processes, and policies that defines standards, assigns ownership, and creates accountability for data across an organization. Data quality is the outcome that good governance makes possible. Governance without a quality program produces well-documented bad data; a quality program without governance produces locally clean data that conflicts across systems. See: data quality vs. data governance.
Data quality is measured using dimension-specific metrics – completeness rate, accuracy rate, duplicate rate, validity rate, and freshness – applied to defined data domains and tracked over time against agreed thresholds. These metrics are typically surfaced in a data quality scorecard for governance audiences and a real-time dashboard for operational teams. See: data quality metrics.
A data quality framework is the operational blueprint that defines how an organization achieves and maintains data quality in practice. It covers data domain scope, role definitions (owners, stewards), quality standards for each domain, processes for issue detection and resolution, and the technology that supports execution. See: data quality framework.
Improving data quality starts with a baseline assessment to understand current state, followed by prioritizing the highest-impact domain or business process, embedding automated quality checks into data pipelines, assigning clear ownership, and establishing ongoing monitoring. For a step-by-step methodology, see: data quality improvement.
Data quality management typically involves a stack of purpose-built tools: profiling tools (to understand current data state), cleansing tools (to correct identified issues), and observability platforms (to monitor quality continuously in production). For a curated overview of leading solutions, see: 10 best data quality tools.
Data quality assurance is the set of upstream processes and standards designed to prevent data quality errors from being introduced in the first place – as distinct from data quality control, which detects and blocks errors that have already occurred. See: data quality assurance.
A data quality scorecard is a structured summary of data quality performance across defined domains and dimensions, showing current scores against targets and tracking trends over time. It serves governance teams and leadership as the primary tool for managing data quality at an organizational level. See: data quality scorecard.